
Introduction: Why Social Media Reporting Matters in 2025
Social media reports aren’t just from the big brands anymore.
It’s important for any digital marketer who runs digital marketing campaigns today.
Imagine running multiple social media campaigns, posting reels, sharing carousel content and running ads.
Yet when someone asks, “How is your social media campaign performing?” there is silence.
In today’s world of digital marketing in Nepal or beyond, just posting content doesn’t cut it.
You need to know what is working, what is wasting your budget and how your content drives ROI.
That’s where a good social media reporting helps.
Creating a social media marketing report helps track what actually matters, such as reach, engagement, leads and ROI.
It offers clarity and direction for your social media strategy efforts.
This blog is a detailed playbook about social media reports, their benefits and how you can create one that helps you make better decisions, turning numbers into action.
What is a Social Media Report?
A social media report is a document that summarizes your brand’s performance on social media platforms such as Facebook, Instagram, TikTok and LinkedIn.
Marketers first gather raw performance data from different platforms such as Meta Business Suite, TikTok Analytics and LinkedIn Analytics.
Then, they organize that data into a report, helping you track the progress of your strategy and understand what worked and what needs improvement.
Think of it as a progress report of your business’s social media, which tracks metrics like:
- How many followers have you gained?
- Which post got the most engagement (likes, comments and shares)?
- How many people clicked on your links?
- Return on investment (ROI), cost per click and leads generated from your ad campaign.
These reports are made weekly, monthly or after a big campaign.
For example, let’s say you run a marketing campaign to promote your new product.
Your monthly social media report might say:
- Instagram gained 2800 new followers
- The reel highlighting the product got 12000 views and 150 shares
- Your product page’s link clicks increased by 18%
- Invested Rs 10,000 on Facebook ads and generated a ROI of Rs 30,000
Feel like this is complex?
Choose a digital marketing agency in Nepal that provides social media services and creates reports so that you can focus only on your business.
Why Social Media Reports are Important?
Creating a social media strategy and posting content is half the job.
If you are not tracking your performance, you are missing out on growth opportunities.
There, the importance of social media reports comes in.
A social media project report gives you a clear picture of what’s happening on your social channels.
It tells you what is performing well, what can be improved and how your brand is growing, all in one place.
Here are some reasons why every business, startup or agency needs a research report on social media marketing:
Importance 1: Track Actual Results, Not Vanity Likes
Businesses that view vanity metrics (likes, comments or shares) as a measure of success are making a big digital marketing mistake.
Those numbers are cool, but they don’t show what really matters.
Making a social media marketing report takes you deeper into actual business outcomes.
Social media reports have metrics that mean something: clicks, leads, conversions, ROI, etc.
For example, instead of saying, “This post got 4000 likes”, your social media monthly reports might show, “This post led to 100 website visitors and 12 product sales.”
This level of detail will help you make smart decisions and imply that your social media strategy is working.
Importance 2: Justify Budget and ROI
Whether you’re reporting on your own page or a client’s, reports demonstrate the investment value of your social media strategy.
Imagine clients asking you:
“Is our social media generating sales?”
With the easy and clear report, your answer is backed by data.
“Yes, our Instagram ad campaign generated 30 purchases, totalling Rs. 3,20,0000 this month.”
ROI measurement helps justify the budget.
And that’s exactly what your clients want to see.
Importance 3: Improve Content and Campaigns
When you see how well your post did or didn’t do, you can be smarter next time.
A good social media report answers questions such as:
What worked with content this month?
What needs to be changed?
You will see which content types (carousel, reel or post) engage audiences, which times bring more traffic and which hashtags drive traffic.
Your monthly social media report acts as a playbook, helping you refine your content strategy and boost reach.
Importance 4: Set Smart Goals
Data will help you set smarter and measurable goals.
A social media report offers you a guideline from which you can build.
Want to increase engagement on Instagram by 20% next month or decrease ads cost-per-click by 15%?
Your report will give you insights to make your plan better.
This is especially critical if you are creating a digital marketing strategy with defined KPIs.
Importance 5: Be Organized and Professional Across Platforms
If you are publishing across multiple social platforms such as Facebook, Instagram, LinkedIn and TikTok, things can get messy real quick.
A social media report helps you give an overall visual summary of your data across platforms with the visual support of graphics.
This means you can keep tabs on your performance without jumping from app to app.
If you’re managing one campaign or five, a monthly report creates a snapshot of anywhere you operate.
Reports are helpful to review posts, assess ROI and keep social media service strategies on track.
This will demonstrate to clients/stakeholders that you have organized, professional work that is data-driven.
What Should a Social Media Report Include?
A social media report is more than a collection of metrics.
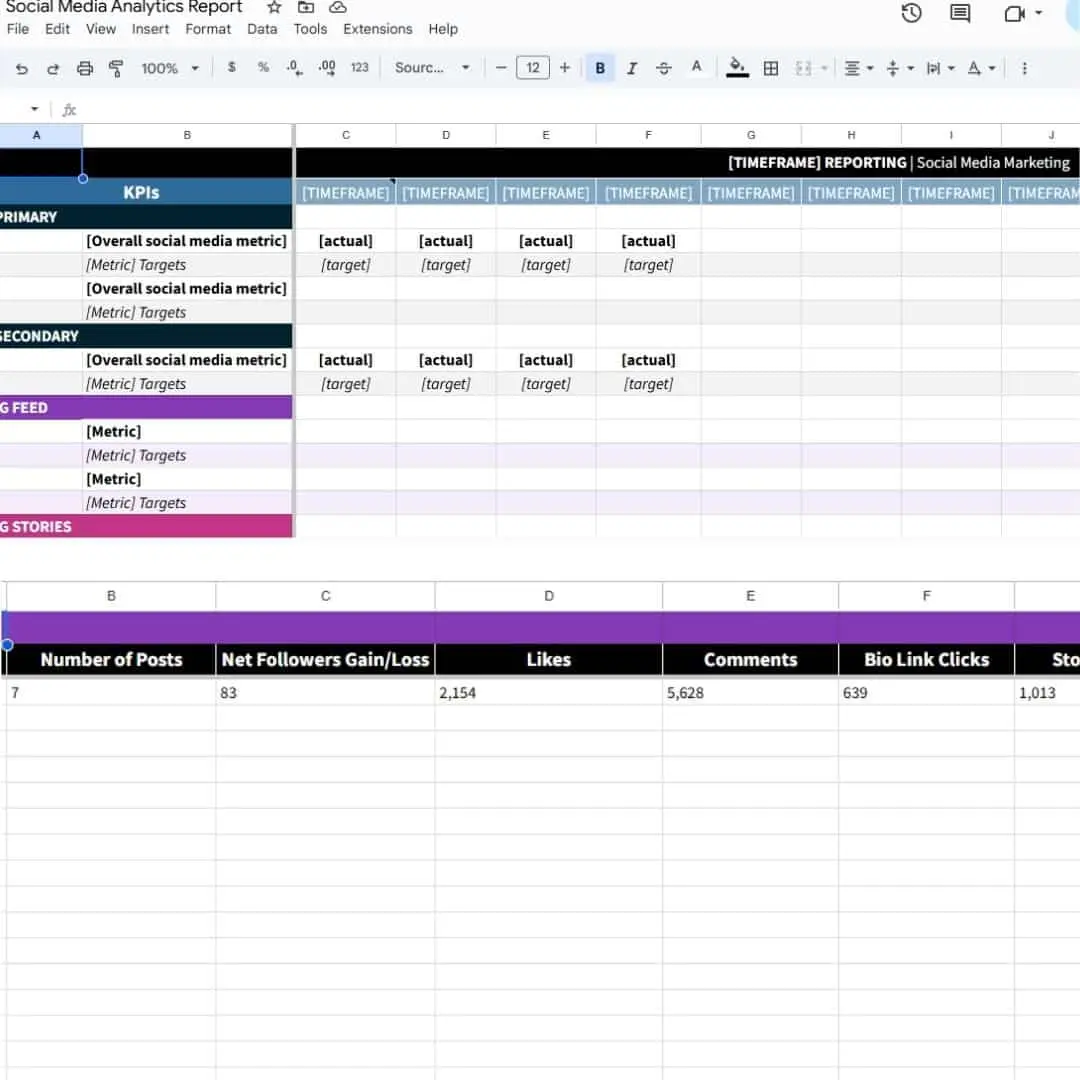
A good social media monthly report format includes metrics like follower increase, reach, engagement rate, CTR and conversion, grouped by channel and content type.
No matter if you’re a marketer, digital agency or content creator, knowing what to include in a social media report will allow you to make good decisions and demonstrate concrete results to clients or stakeholders.
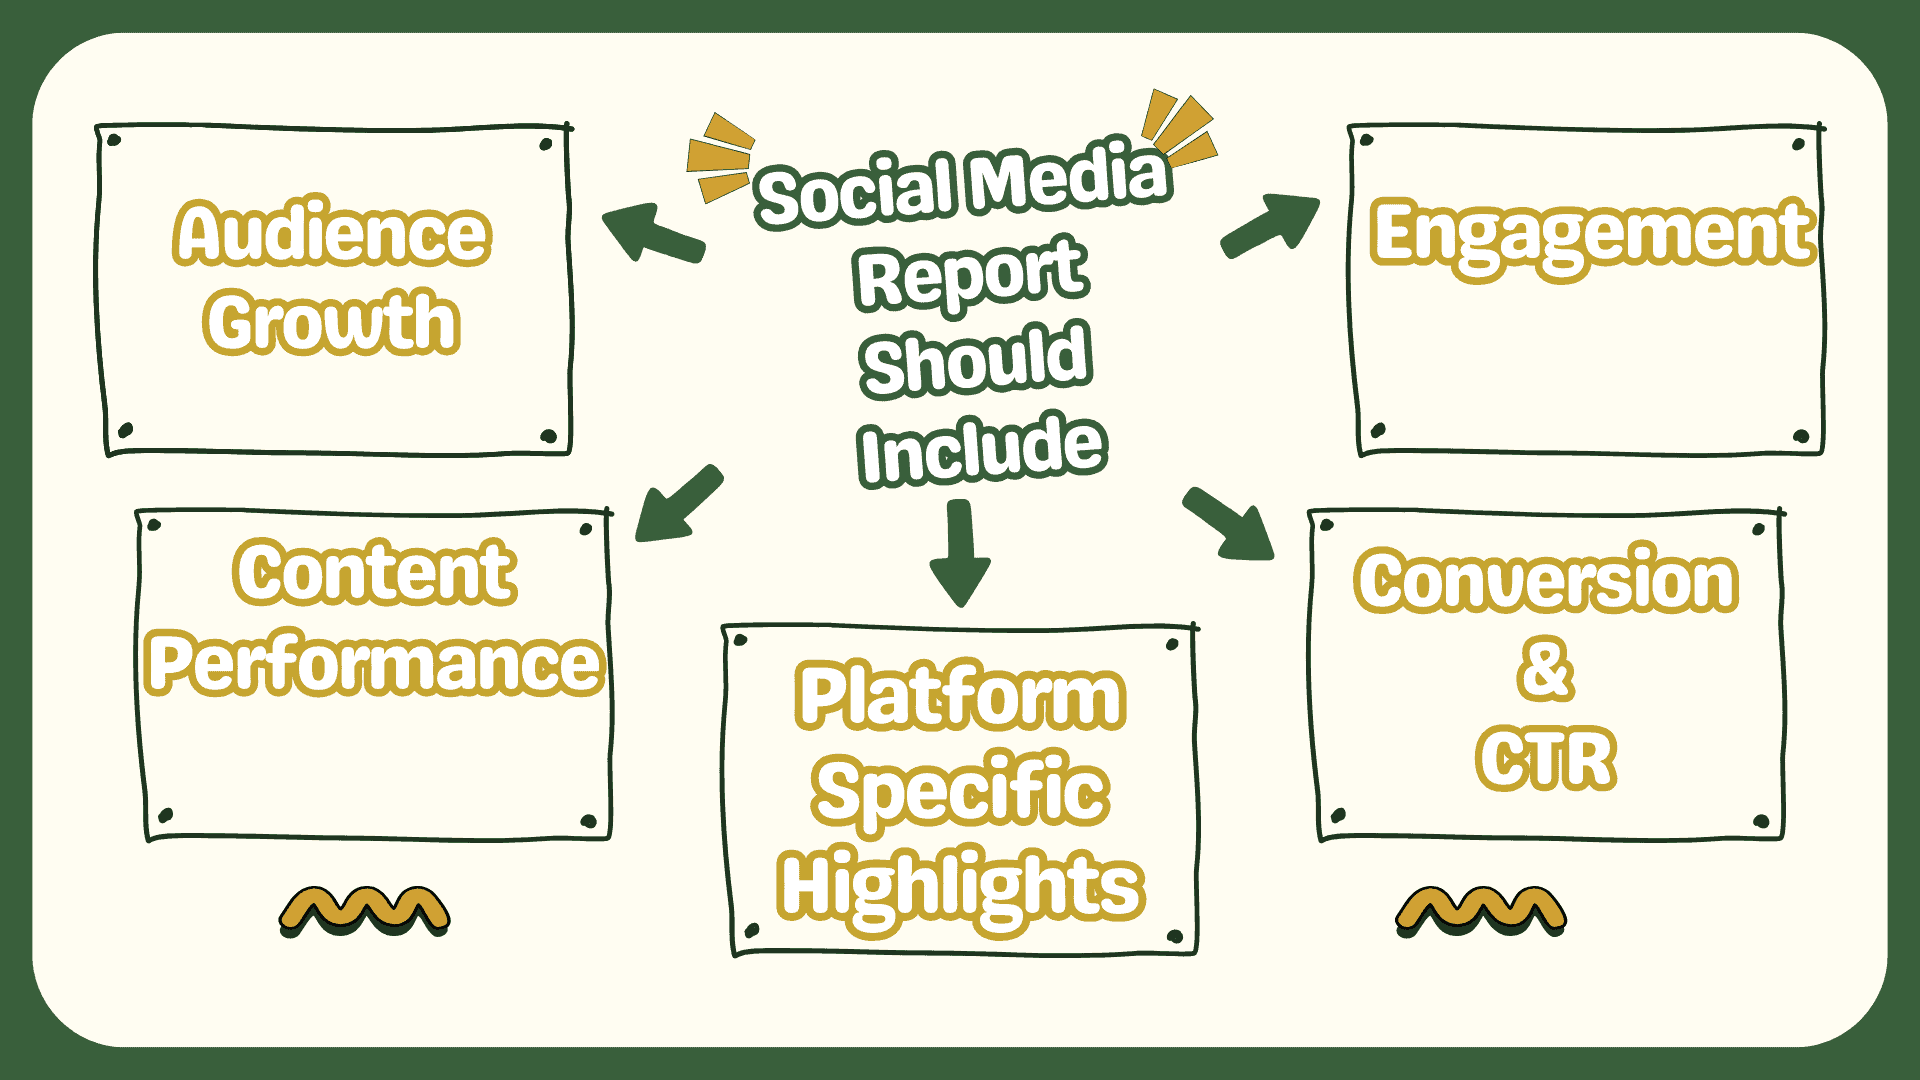
Here is what all social media reports need to include:
Audience Growth and Engagement Metrics
These metrics are the foundation of your social media project reports.
Monitor your audience growth and engagement to find out the reach of your social media strategy.
Your brand visibility is represented through metrics such as followers, impressions and engagement rates from the Meta Business Suite and other social media analytics tools.
- Followers: When reporting your social media metrics, be sure to count new followers, e.g., 1,500 followers per month, to track their audience growth.
- Impressions & reach: You should be tracking the number of impressions, i.e., 15,000 impressions, a prime measure of a brand’s visibility.
- Engagement: You should also track interaction levels, i.e., likes, comments and shares, with a target of 5 percent engagement to demonstrate how active audiences are with the brand content.
Use these to demonstrate your rise in brand visibility and how engaging your content is.
Content Performance Metrics
Not every piece of content performs equally.
In order to maximize your social media content strategy, you must understand what’s working best.
Social media performance metrics like conversion rate tell you your next content plans.
Here in this section of your social media monthly report, you’ll want to report your best-performing content based on:
- Post type: Which formats yielded results? Were they reels, carousels, stories or single-image posts?
- Engagement rate per post: What content had the highest engagement numbers?
- Platform breakdown: Compare performance across various platforms like Instagram, Facebook and LinkedIn.
Example: An Instagram 15-second reel getting 25% more engagement than a static post, informing growth goals.
These learnings will aid in smarter planning for the upcoming months.
Conversion and Click-Through Metrics
If traffic, leads, or revenue are on your mind, this is where the report turns serious.
You measure activities such as link clicks and conversions in your social media reports to demonstrate proof of ROI measurement.
For example, if the cafe mentioned they received 500 clicks through to their menu page, driving 20 bookings in total, that shows it was a good post!
Use this section to share how your content and ads drive visits, leads and conversions.
- Link Clicks: Show how many users clicked through to your site from bio links, stories, and ads.
- Website Visits: Use Google Analytics for social media reporting and be able to drive traffic back to specific posts.
- Leads & Sign-ups: Use results from campaigns such as downloading free eBooks and newsletter sign-ups.
- Conversions: Include purchases or form completions from posts coming from platforms like Instagram and Facebook.
This provides evidence that your social media strategy impacts revenue-generating actions.
Ad Campaign Results
If you’re using paid advertisements, your social media marketing report needs to prove what is working and what isn’t.
Ad campaign metrics show how you utilize your money (to provide awareness, clicks or purchases).
For paid campaigns, include ad metrics such as ROAS and CPC, as per the Facebook Ads Guide, when justifying budgets in your social media ads performance report.
What metrics matter to include:
- Impressions & Reach: How many people saw your ad content?
- CTR (Click-Through Rate): CTR measures the interests of audiences. If you have a high CTR, it shows that your copy and creative worked.
- CPC (cost per click): It shows how much costs does 1 click costs you. If you have a low CPC, you have achieved better targeting.
- ROAS (Return on Ad Spend): Shows how much gain you actually got for your money. For example, if you spent $500 on the ad campaign and you generated $5000 in revenue, you would have a 10x ROAS.
- CPA (cost per acquisition): Tells you the cost of acquisition for either a customer or a lead.
These results aren’t just numbers.
Overall, they help validate your budget and optimize future campaigns, adding rapport & trust with clients.
Platform-Specific Highlights
Every platform is different, so your monthly social media report should be too.
Rather than treating all platforms the same, break down the specifics that worked best for each.
This way, you get a clearer idea of where to put your effort or budget.
Things to include per platform:
- Facebook: Ad engagement, post shares and page reach
- Instagram: Reel views, story taps, saves and new followers
- LinkedIn: Article clicks, profile visits and professional engagement
- TikTok: Video views, trend traction and audience growth
By including the key highlights per platform, you are giving your client or team a clear view of the best-performing tactics.

How to Create a Social Media Report?
Creating a social media report is more than just reporting numbers.
It’s about telling a story of how your social media strategy fuels growth.
This step-by-step process will help you understand how to create a simple social media reports that demonstrate value:
eLance, follows these simple steps for creating social media reports, which you can follow too, whether you are a freelance consultant or a brand looking to track growth.
Step 1: Identify the Objectives of Reporting
Before you use any analytical tools, you should ask one critical question to yourself:
“What do I want from this social media report?”
If you don’t have specific goals, your report will just become a collection of confusing numbers.
Here are guidelines for how to set your reporting goals depending on the campaign types:
| Campaign Type | Reporting Goals |
| Brand Awareness Campaign | Reach, impressions and engagement |
| Lead Generation Campaign | link clicks, conversions and CPA |
| Facebook Ad Campaign | ROAS, CPC and CTR |
| Audience Growth/Community Building | followers gained, profile visits, saves and shares |
| E-commerce Promotion | website traffic, sales conversion and product clicks. |
At eLance, before building any of our social media marketing reports, we hold a goal mapping session.
There, we align what our client wants and what the objectives are, such as whether the goal is for purchases, following, etc.
Step 2: Choose a Reporting Timeframe
After you finalize your objectives, the next step is to determine your reporting timeframe.
That means you should decide how often to report your results, which can be on a weekly, monthly or campaign basis.
Your timeframe should account for:
- The type of a campaign
- Client or stakeholder expectations
- Content publishing cycle
| Reporting Frequency | Best for |
| Weekly Reports | High-volume posting, shorter campaigns and fast feedback loops |
| Monthly Reports | Strategy reviews, performance summaries and retainer client reports |
| Campaign Reports | One-off or seasonal campaigns (eg, Dashain, Christmas, New Year, etc.) |
For Instance:
Let’s say you are managing a travel agency’s monthly content calendar on Facebook and Instagram.
You publish 3 posts per week on those channels and also run ad campaigns at certain times during festivals.
Here, a social media monthly report format would work best as it gives you an opportunity to gather enough data to cover the time period, without overwhelming clients with data.
Step 3: Select Metrics That Align with Your Goals
Now, it’s time to decide which KPIs matter the most.
Your social media report should only include metrics that are relevant to your social media strategy goals.
You will want to align key digital marketing metrics with your goals to ensure that you do not report on vanity metrics and will want to focus on the metrics that matter:
| Goals | Key Metrics to Track |
| Brand Awareness | Reach, impressions, profile visits and follower growth |
| Engagement | Likes, Shares, Comments and Engagement Rate |
| Website Traffic | Link clicks, referral traffic and landing page views |
| Lead Generation | Sign-ups, form filled and messenger leads |
| Sales/Conversion | Purchase conversions, ROAS, CPA and click-through rates |
eLance has created reports for many clients, checking that every report maps back to the campaign goals, objectives and deliverables.
Step 4: Gather Data from Platforms and Tools
Once your goals and KPIs to include are set, it’s time to collect the data from the social media reporting platforms or tools.
This step involves pulling performance data from either native platforms or third-party tools.
You must access the right data and present it accurately and clearly.
So, where can you source your social media data from?
Here are the best digital marketing tools from which you can gain insights into your performance:
Native Platforms (Free and Trustworthy)
These provide free, built-in analytics and are more than adequate for beginners:
- Meta Business Suite: For Facebook & Instagram, including reach, engagement, link clicks and conversions.
- LinkedIn Analytics: Great for B2B brands as it helps review impressions, engagement and followers.
- TikTok Analytics: Video views, profile visits/traffic and trends.
- YouTube Studio: Allows you to analyze watch time, CTR and followers.
Third-Party Tools for Streamlined Reporting
- Google Analytics for Social Media Reporting: Track traffic and conversions from social posts, including UTM tags.
- Hootsuite/Sprout Social: These tools will aggregate insights to one dashboard, useful for monthly reports
Step 5: Visualize Your Data Clearly
Even the most impressive data is not useful if your client (or team) cannot decipher it.
A solid social media report does not just throw down numbers, it translates them into a narrative.
Visualizing your KPIs helps to convey your insights in a digestible way, especially for a non-marketer.
Why is data visualization important?
- It provides immediate clarity on trends, wins and red flags.
- It helps clients or stakeholders tie performance to results.
- It reduces confusion and gives more faith to your social media marketing report.
Things to Consider Visualizing (and How)
Growth Metrics
Use a simple line chart to show follower growth month over month, which allows for a clear visual of audience momentum.
Top Performing Content
Create a small table/grid showing the top 3 posts with:
- Post type (reel, carousel or story)
- Engagement rate
- Impressions
Ad Campaigns
Compare your cost per click (CPC), click-through rate (CTR) and return on ad spend (ROAS) using bar charts.
Platform-specific Performance
Pie charts or stacked bars can slice performance by channel—ideal for comparing Facebook vs. Instagram vs. LinkedIn.
Step 6: Add Context, Recommendations and Learnings
Raw numbers don’t tell the whole story.
The real value of a social media report is in the context and the insights, meaning “why” behind the numbers and what to do with them.
Why Context Matters:
Your clients and stakeholders are looking for meaning, not just metrics.
They want to know:
- Why did this post get engagement?
- Why did engagement drop this week?
- What can we do more or less of next month?
If the reports do not have the context of your findings, the social media report becomes another document.
With context, it becomes a plan.
So, what to include
What Went Well
Summarize the posts, ads or formats that worked best and explain why.
For example, reels with trending sounds had 3 times more reach than static posts. Short-form video is outperforming everything.
What Did Not Go Well
Share what did not perform well and the potential reasons for the underperformance.
An example of this can be, “posts made during holidays got lower engagement.”
Recommended Actions for Next Month
Provide 2–3 actionable items based on insights.
- Use more reels to capture audiences, instead of static posts
- Try new content pillars, such as frequently asked questions
- Post Instagram carousels during the week and gain more reach
In this way, your social media report becomes a narrative, showing what occurred, the reasons, its cause and how these actions will be addressed next.
How to Automate Social Media Reports and Save Time?
Manually creating a social media report every week can be exhausting, especially if you are scaling.
Today, marketers prefer to use digital marketing tools to automate social media reports and use their time better for strategy.
If you are starting out, you can use free tools for beginner-friendly social media reports, such as:
- Meta Business Suite: Auto-generate insights for Facebook and Instagram.
- LinkedIn Analytics: Track post reach, impressions and engagement.
And as for tracking website traffic, have a look at Google Analytics for social media reporting.
Set up UTM parameters on your social media links to track link clicks, session time and conversions.
When you are ready to step it up, consider:
- Hootsuite: Both generate a full month report on social media reports with your KPIs and graphs and comparisons across platforms.
- Sprout Social: It is great if you are working with a pretty big team that needs a deeper analysis.
Many teams are now using AI and digital marketing tools such as ChatGPT or Jasper AI to speed up reporting tasks.
These tools summarize insights, content triggers and even a monthly ‘to-do’ checklist for your monthly reports.
Automation saves you multiple hours, reduces human errors, and ensures your social media strategy is always based on real results.
Mistakes to Avoid in Social Media Report
Writing a social report is one thing; making it meaningful is another.
Many marketers find themselves making preventable pitfalls that diminish clarity, consume time and confuse clients.
Here are a few of the most common mistakes when it comes to reporting:
Too Many Metrics
Don’t stuff your report with every number that can be counted.
This will lead to your report being overwhelming and clients are left confused.
Focus on the KPIs that align with your business goals: clicks, conversions and engagement.
This gives the social strategy organization and subsequent action.
The Story Within the Data
Numbers are just noise if there’s no context behind them.
Any research report on social media should explain why something worked or didn’t work.
Add short takeaways or next steps after each chart or table.
Using the Same Template for All Clients
Every brand is different.
Using the same social media project report format for a B2B brand and a local café just won’t work.
Custom visuals, KPIs and goals should be outlined for each client.
Missing Cross-Platform Performance
Your report must show performance across platforms like Facebook, Instagram, TikTok and LinkedIn.
If the report doesn’t include this information, you are missing insight, such as which platform can get you the best engagement and ROI.
Neglecting to Automate the Reporting
Reporting manually is time-consuming and can lead to mistakes.
So, use automated social media reporting tools to streamline the process.
This will allow you to see how to generate monthly social media reports easily.
Conclusion
Creating a social media report isn’t about checking off boxes, it’s about interpreting what’s working well and what’s not.
The difference between a well-planned social media strategy and an ineffective one is (largely) about how you track the right metrics and present them in a format that translates to action.
When it comes to execution, over and over again, we encounter people producing reports that are just reporting likes, rather than interpreting and extracting actionable outcomes.
Utilize the steps and tools we’ve included to develop reports that add much more value than likes.
Avoid common mistakes, automate, letting the results flow without fear and track what’s really making an impact.
Wouldn’t it be more exciting to stop guessing and start growing?
Let Elance help you turn data into decisions, utilizing the full benefits of digital marketing.
We help you track, analyze and scale your social media strategy, minus the stress.
FAQs
You should follow these steps to write social reports:
Set Clear Reporting Objectives
Choose a Reporting Timeframe
Select Metrics That Align with Your Goals
Gather Data from Platforms and Tools
Visualize Your Data Clearly
Add Context, Recommendations and Learnings
Some of the standard KPIs include reach, impressions, engagement rate, link clicks, conversions, follower growth and ad performance metrics (CTR, CPC, and ROAS).
Some tools to automate social media reports are:
Hootsuite
Buffer
Sprout Social
Google Looker Studio
Many of these tools have templates and scheduling abilities that will likely save you time.
Meta Business Suite is perfect for beginners. Otherwise, Hootsuite, Looker Studio (formerly Data Studio) and other tools provide options for more advanced features and insights with no cost.
Use weekly reporting with active campaigns, with fast feedback and monthly reporting for strategy reviews, growth and client summaries.
Stick to five or seven key metrics: Reach, engagement, followers, link clicks, conversions, CTR and one KPI that meets the goal.
This helps prevent data overload.
Absolutely!
You can manually enter data into Excel or Google Sheets or use Google Analytics or Looker Studio to create fully customized reports, either using their standard reports or customizing them as you want.

